Where Will Charlotte Crashes Cluster Next Month?
A machine-learning study that forecasts monthly reported crash counts across 500-meter Charlotte grid cells and identifies areas that may deserve closer transportation-safety review.
View Code on GitHubProject Overview
Reported crashes are not distributed evenly across Charlotte. This project tests whether recent crash history can help identify the small set of areas likely to contain a larger share of next month's reported crashes. Each prediction is a count for one 500-meter grid cell and one calendar month. The cells are then ranked to support closer review. The model does not predict the exact location or time of an individual crash.
Can past crash patterns predict which 500-meter areas of Charlotte will have higher reported crash counts next month, and do separate morning and afternoon forecasts improve the hotspot picture?
Main Takeaway
Past crash counts helped identify where future reported crashes clustered, but the improvement over a straightforward history-based baseline was modest. In December 2024, the top-ranked 5% of cells captured 41.5% of all-day reported crashes. Separate morning and afternoon models did not meaningfully improve the hotspot rankings, so the all-day monthly model remained the main result.
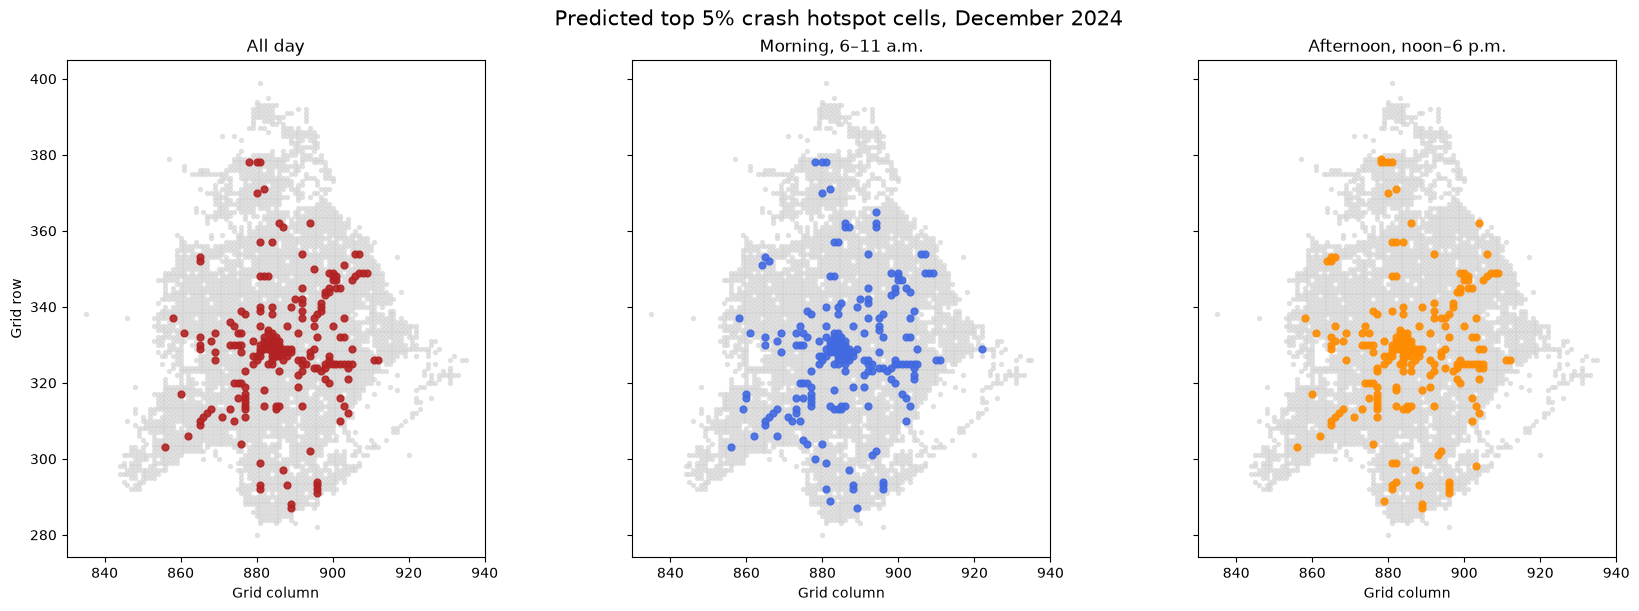
1,604 of 3,864 December crashes in the predicted top 5% of cells
406 of 1,058 December morning crashes
855 of 2,009 December afternoon crashes
My Contribution
I cleaned and prepared public crash records, converted locations into 500-meter spatial cells, created time-based lag features, built chronological training and evaluation periods, compared a baseline with decision-tree and linear-regression models, and evaluated both prediction error and hotspot capture. I also examined weather, time-of-day patterns, model interpretation, and responsible-use limitations.
Purpose and Value
A ranked list of areas could help transportation analysts decide where to begin a closer safety review. It should be combined with traffic volume, road design, field observations, and community input. It is an exploratory screening tool, not a recommendation for enforcement or resource allocation by itself.
Data and Methods
The main source contained 540,865 crash records covering 2010 through 2026 at the time of analysis. The modeling period uses 2018 through 2024. After the year and location checks, 276,118 crash records remained.
Each modeling row represents one 500-meter grid cell in one calendar month. The fixed study area contains 4,146 cells observed by the end of 2022 and 348,264 cell-month rows from January 2018 through December 2024. About 69% of those rows contain zero crashes.
The training period runs from April 2018 through December 2022. The year 2023 is used to compare models and settings, and 2024 is used for evaluation. Forecasts roll forward one month at a time, so a December forecast can use observed information through November.
Data Cleaning and Validation
I converted crash timestamps to Charlotte local dates, checked crash identifiers, removed records with missing or implausible Charlotte-area coordinates, and assigned each retained point to a 500-meter square using projected coordinates.
I added zero-crash rows for every month in each selected cell so the model would learn from both active and quiet locations. Previous-month features were shifted by one month to prevent the model from seeing the outcome it was trying to predict.
The final predictors were grid location, calendar month, last month's crash count, the prior three-month average, and the prior 12-month average. Negative linear predictions were set to zero because a crash count cannot be negative.
Daily airport weather was explored, but observed weather from the forecast month was not used as an input because it would not be known when the forecast was created.
Model Comparison
Mean absolute error (MAE) is the average size of the prediction error for one cell-month. Lower MAE is better. The final column measures how many 2024 crashes occurred within each month's predicted top 5% of cells.
| Method | 2023 Validation MAE | 2024 Evaluation MAE | 2024 Crash Share in Top 5% |
|---|---|---|---|
| Prior three-month average | 0.585 | 0.588 | 40.0% |
| Decision tree | 0.571 | 0.568 | 41.0% |
| Linear regression | 0.565 | 0.564 | 41.1% |
What the Analysis Shows
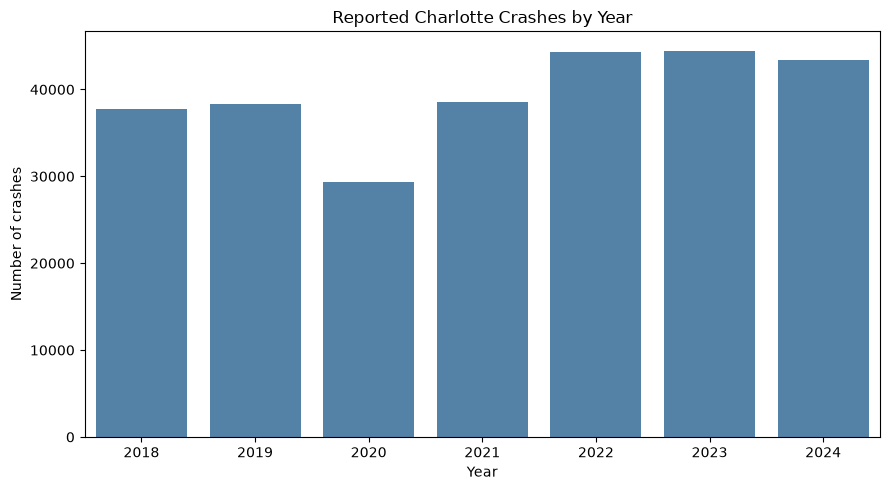
Reported crashes changed over the study period
The yearly totals show a clear decline in 2020 followed by later changes. The chart is descriptive and the study does not assign a cause to those changes.
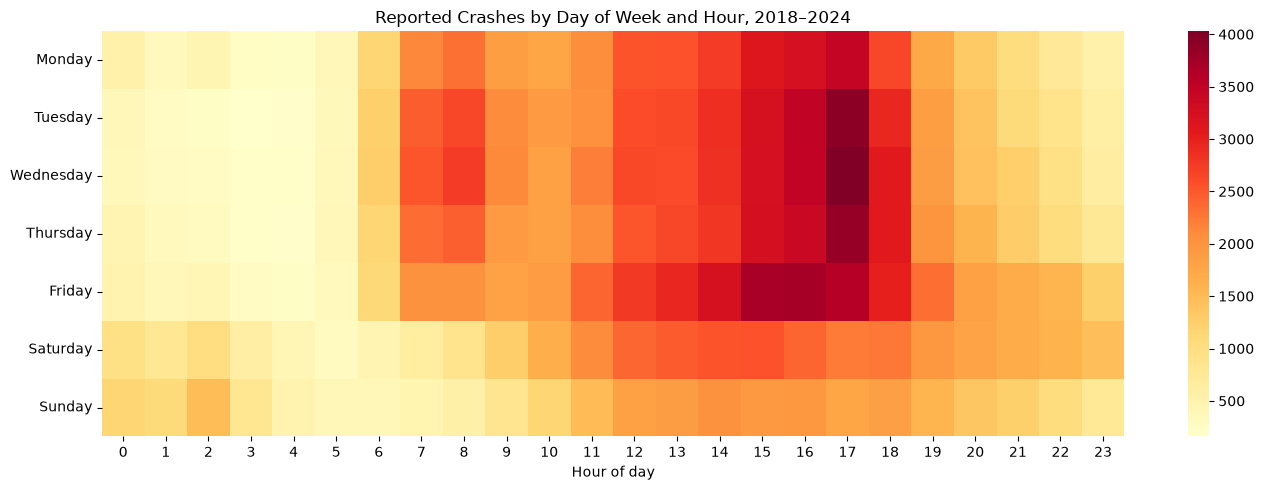
Afternoon hours contain many of the reported crashes
The day-and-hour pattern shows particularly high counts on weekday afternoons. Because the data does not include traffic exposure, this describes when crashes were reported rather than a driver's per-trip risk.
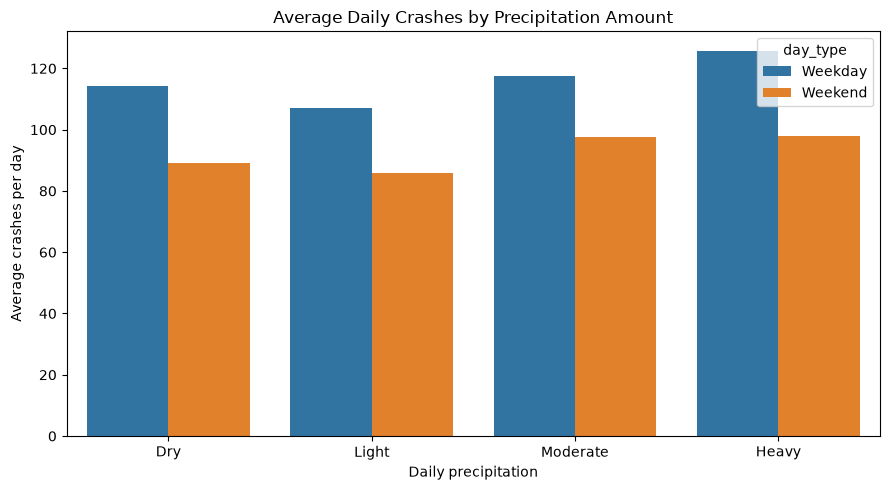
Weather was useful context but not a forecast input
The data averaged 107.2 reported crashes on dry days and 109.6 on wet days. This small descriptive difference does not establish that rain caused more crashes. Airport weather also does not represent conditions at every road and hour.
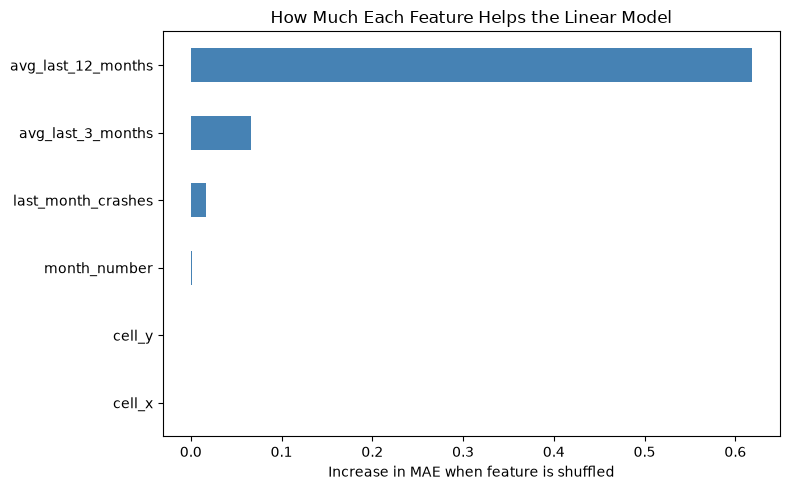
Recent yearly history was the model's strongest feature
The previous 12-month average was the most useful feature in the permutation test. The three-month average and last month's count also helped. Calendar month and grid coordinates added little once recent crash history was included. These overlapping features should not be interpreted as independent causes.
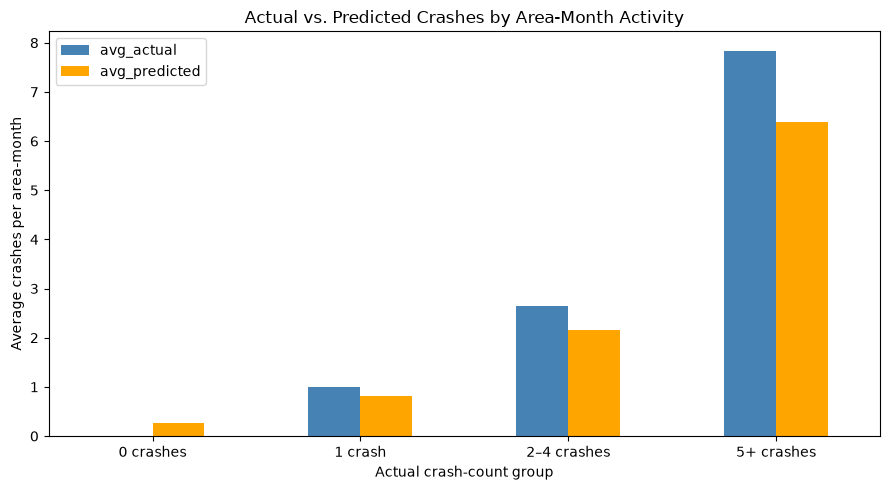
The model underpredicted the busiest cell-months
For cell-months with at least five crashes, the average observed count was 7.84 while the average prediction was 6.38. The overall error looks smaller partly because most cell-months have zero or very few crashes.
The top-ranked cells captured a large share of December crashes
The all-day model's predicted top 5% of cells contained 1,604 of 3,864 reported December crashes. The morning and afternoon maps show how the shortlist changes by time period.
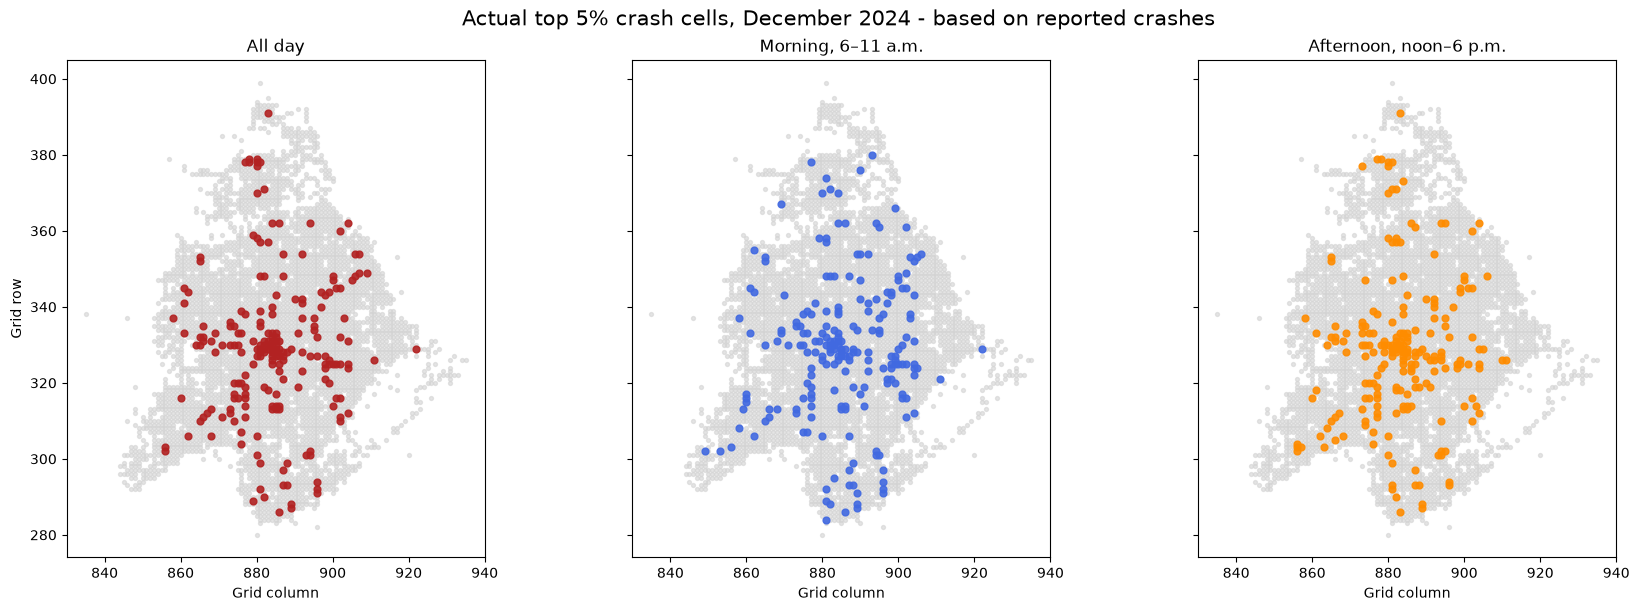
Observed busy cells were more dispersed than the main predicted cluster
Several of the cells with the largest recorded December counts align with the central predicted cluster, while other busy cells are scattered more widely. Ties among low-count cells can affect exact top-5% membership.
Limitations and Next Steps
The results are useful for finding patterns, but they need to be read with care.
- A high crash count can reflect a busy road rather than a higher crash rate per driver. Without traffic-volume data, the study cannot compare personal driving risk across locations.
- The coordinate filter is a practical Charlotte-area rectangle rather than an official municipal boundary, and the fixed study area excludes cells first observed after 2022.
- The linear model performs less accurately in the busiest cells and tends to underpredict their counts. A low-ranked cell that later experiences many crashes could be missed during screening.
- Crash reports may reflect differences in recording practices or location accuracy. The results should not be used to label residents or neighborhoods as unsafe or to guide enforcement on their own.
- A stronger follow-up would add roadway characteristics, traffic exposure, archived weather forecasts, and later untouched evaluation years.
Tools and Methods
References
References are formatted in APA style. The second column explains how each source contributed to the project.
| APA Citation | Role in the Analysis |
|---|---|
| Charlotte Department of Transportation (n.d.). Crashes [Data set]. City of Charlotte ArcGIS REST Services. https://gis.charlottenc.gov/arcgis/rest/services/CDOT/TCLS_Crashes/MapServer/0 | Provided crash identifiers, dates, times, and coordinates used to create spatial cells, lagged counts, and evaluation results. |
| Federal Highway Administration (n.d.-a). Rain & flooding. U.S. Department of Transportation. https://ops.fhwa.dot.gov/weather/weather_events/rain_flooding.htm | Provided context for exploring the relationship between wet conditions and roadway safety. |
| Federal Highway Administration (n.d.-b). Screening your network to improve roadway safety performance: Getting started. U.S. Department of Transportation. https://highways.dot.gov/safety/data-analysis-tools/systemic/screening-your-network-improve-roadway-safety-performance | Provided background on using crash history and roadway information to identify locations for closer safety investigation. |
| National Centers for Environmental Information (n.d.). Charlotte Douglas Airport, NC US: Local climatological data station details [Data set]. National Oceanic and Atmospheric Administration. https://www.ncei.noaa.gov/cdo-web/datasets/LCD/stations/WBAN%3A13881/detail | Provided daily precipitation and temperature observations for the exploratory weather comparison. |