Under Pressure: Housing Affordability and Displacement Vulnerability
An exploratory data science study of housing affordability pressure and displacement vulnerability across Mecklenburg County census tracts and Charlotte neighborhoods.
View Code on GitHubProject Overview
This project began with a broad question about displacement risk and gentrification. After reviewing the available data, I narrowed the analysis to outcomes the datasets could support: characteristics associated with rent burden across Mecklenburg County census tracts and a separate description of the City of Charlotte's displacement-vulnerability classification. Keeping those analyses separate prevented the project from treating a constructed vulnerability score as proof that displacement occurred.
Original Research Question
What housing, demographic, and economic factors are most strongly associated with displacement risk in Charlotte neighborhoods, and to what extent can changes in affordable housing, income, and housing costs identify communities experiencing gentrification?
The scope was refined after evaluating what the available data could measure responsibly.
Which housing, demographic, and economic characteristics are associated with rent burden across Mecklenburg County census tracts, and what patterns of neighborhood displacement vulnerability appear in City of Charlotte data?
Main Takeaway
Income and educational attainment were the factors most strongly associated with renter affordability pressure. These conditions may increase vulnerability to displacement because financially burdened households have less ability to absorb rent increases or income losses. However, the data does not prove that displacement or gentrification occurred because it does not directly measure forced moves or consistent neighborhood changes over time.
My Contribution
I collected public data through the U.S. Census Bureau and City of Charlotte APIs, cleaned and merged tract-level measurements, handled missing observations, explored housing and demographic variables, and created visualizations to compare affordability patterns. I also documented the limits of the analysis so associations would not be presented as causal findings.
Purpose and Value
The question remains relevant to residents, housing organizations, and local planners because affordability pressure may leave households less able to absorb a rent increase or income loss. The analysis identifies patterns worth investigating, but it does not estimate a household's probability of displacement or identify neighborhoods that have gentrified.
Data and Methods
The ACS figures summarize estimates collected across 2020–2024, not measurements from one moment in 2024. The July 2025 label in the Housing Locational Tool identifies a snapshot and does not confirm that every underlying City measure was observed in 2025.
Census tracts and Neighborhood Profile Areas are different geographic units. Census tables were joined by state, county, and tract codes, while City tables were joined by NPA identifiers. I analyzed the two geographies separately and did not directly merge NPAs with census tracts. Mecklenburg County also includes places outside Charlotte's municipal limits.
The merged ACS data contained 305 tract records. The final comparison used 296 tracts after excluding nine records missing a required measurement.
Data Cleaning and Validation
I converted Census fields into usable numeric values and treated negative placeholder codes as missing instead of real incomes, rents, or counts. This let me keep the other valid measurements from a tract rather than removing the entire record. City percentage fields were cleaned by removing percent symbols, while legitimate zero counts were preserved.
Rent burden was calculated from ACS table B25070 after removing households whose burden could not be computed. I combined the categories spending 30% or more of income on rent and used checks that prevented incomplete counts or invalid denominators from producing misleading percentages.
I required one-to-one identifier matches so duplicate records would cause an error instead of silently multiplying rows. The City API was downloaded in pages, and fields with unclear or implausible values, including the available sales-price summaries, were excluded from the conclusions. The final correlation comparison used the same 296 complete tracts for every characteristic.
How the Study Measures Each Concept
| Concept | Definition | Source |
|---|---|---|
| Rent burden | Cash-rent renter households spending at least 30% of household income on gross rent, divided by renter households with computable burden. | ACS B25070 |
| Severe rent burden | The same renter-household denominator, but spending at least 50% of income on gross rent. This group is already included in the 30% or more measure. | ACS B25070 |
| Income and housing costs | Median annual household income for all households and median monthly gross rent, including applicable utilities. | ACS B19013 and B25064 |
| Unemployment | Unemployed civilians divided by the civilian labor force, multiplied by 100. | ACS B23025 |
| Educational attainment | Adults age 25 or older with a bachelor's, master's, professional, or doctoral degree as a percentage of all adults age 25 or older. | ACS B15003 |
| Racial and ethnic composition | Population shares for seven non-Hispanic racial categories and Hispanic or Latino residents of any race. | ACS B03002 |
| Renter share | Renter-occupied housing units divided by all occupied housing units, multiplied by 100. | ACS B25003 |
| Displacement vulnerability | The City's existing 0–5 score and Yes or No classification. These are classifications, not observed displacement or calibrated probabilities. | City displacement layer |
What the Analysis Shows
Housing costs provide context, but do not describe affordability by themselves
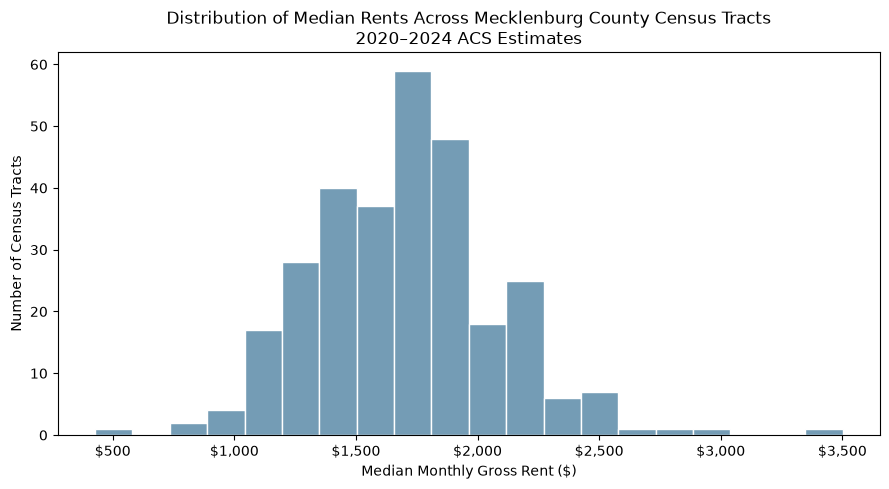
Most tract median rents fall between about $1,200 and $2,200 per month, with fewer tracts at the extremes. This describes neighborhood medians, not the rents paid by every household or the number of units available at each price.
Similar rent levels can come with very different affordability pressure
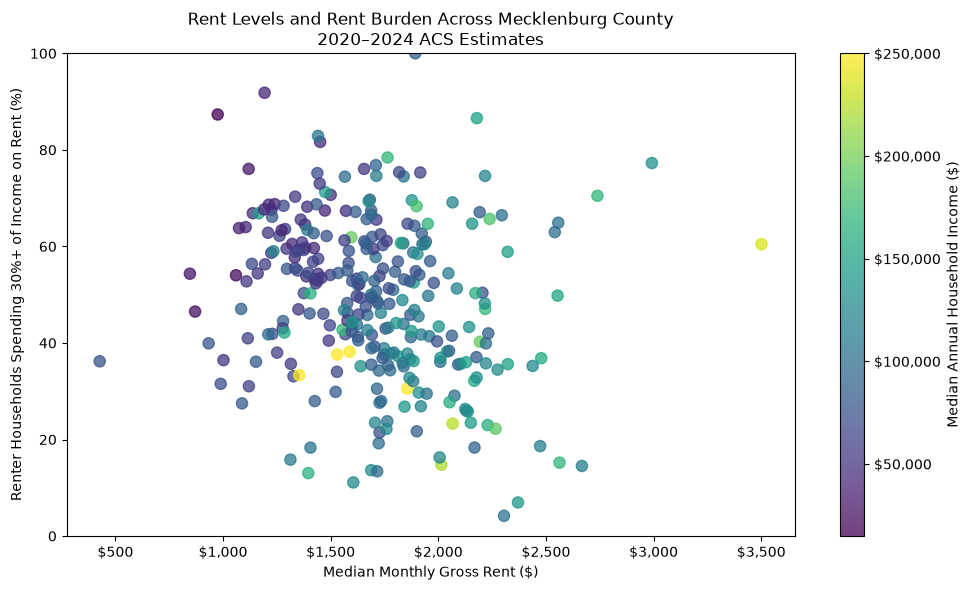
Tracts with similar median rents show very different rent-burden rates. The income color scale adds context, but it represents all households rather than renter households specifically. A higher neighborhood median rent does not automatically mean a larger share of renters is burdened.
Income and education show the strongest observed associations
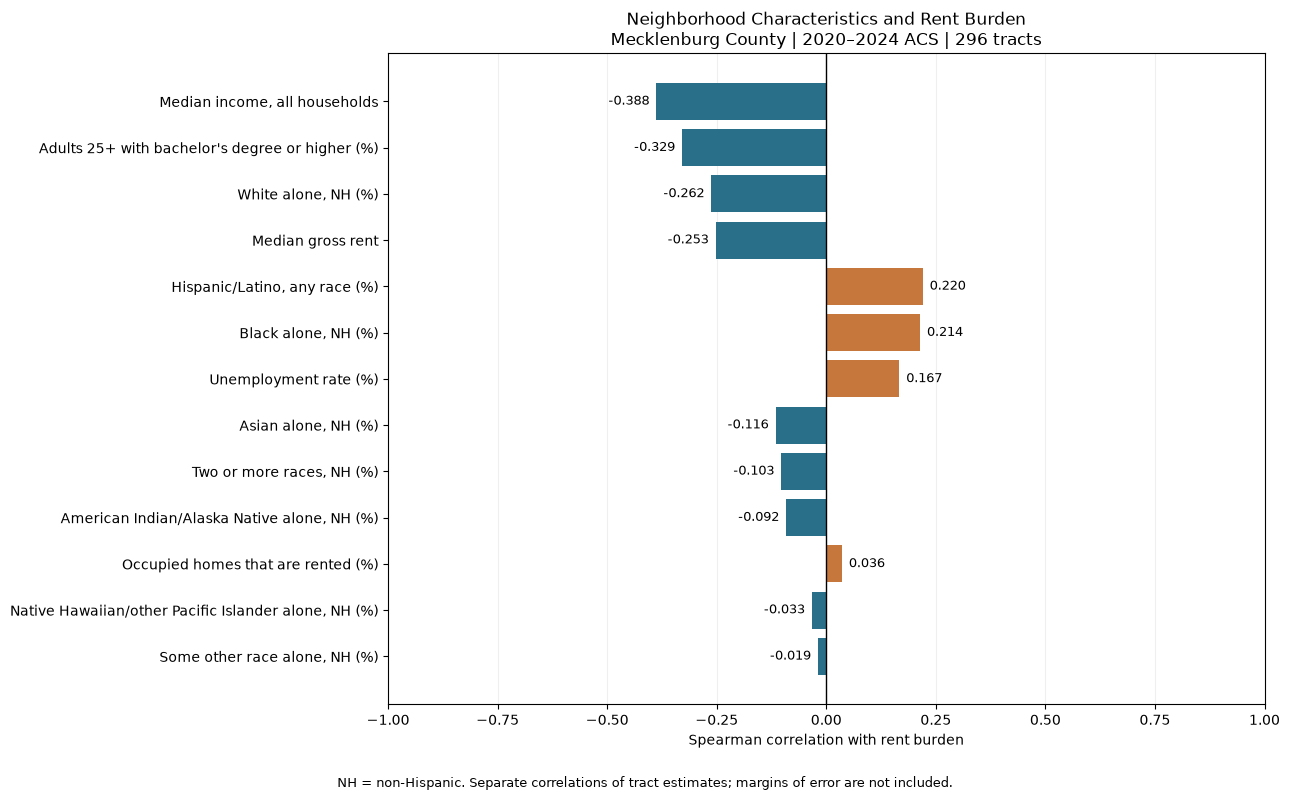
Median household income has the largest absolute Spearman correlation with rent burden at −0.388, followed by the share of adults with a bachelor's degree or higher at −0.329. Median rent is −0.253, unemployment is 0.167, and renter share is close to zero at 0.036. These coefficients show direction and strength of association, not how much hardship each characteristic causes.
Race and ethnicity results describe places, not individual experiences
The Hispanic or Latino population share has a correlation of 0.220 with rent burden, while the non-Hispanic Black share is 0.214 and the non-Hispanic White share is −0.262. These tract-level relationships cannot show the burden experienced by individual racial or ethnic groups. Income, wealth, housing access, and historical segregation are important context for future research, not mechanisms proven by this study.
The highest estimates are not precise neighborhood rankings
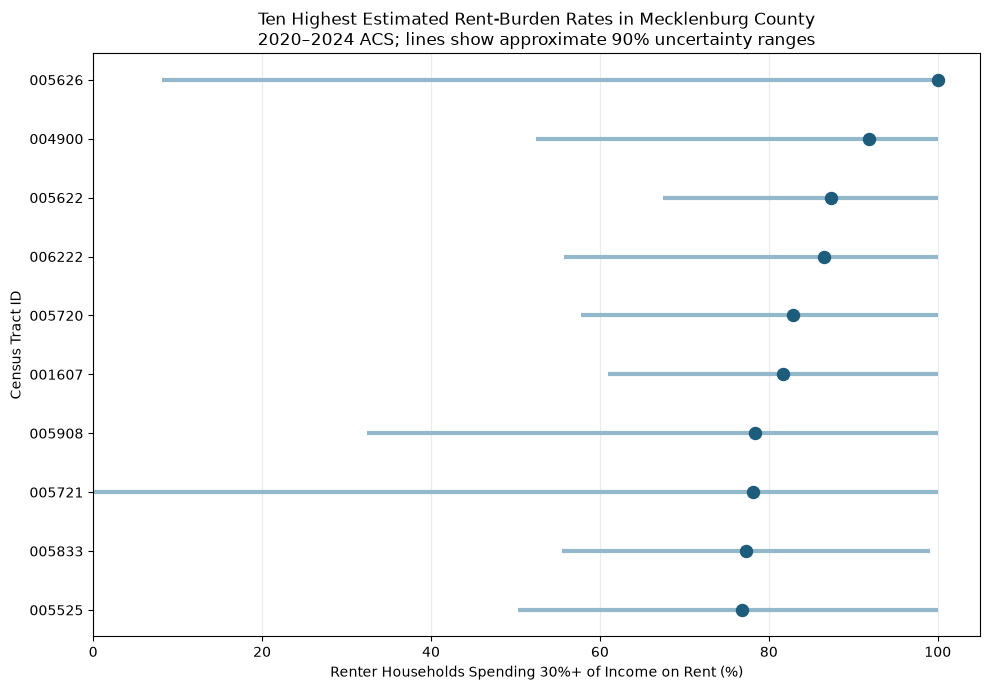
Several tracts with high point estimates also have very wide approximate 90% uncertainty ranges. For example, the displayed range for tract 005721 spans 0%–100%. The chart helps identify places worth examining, but it does not justify declaring one tract definitively more affected than another.
City data provides a separate neighborhood perspective
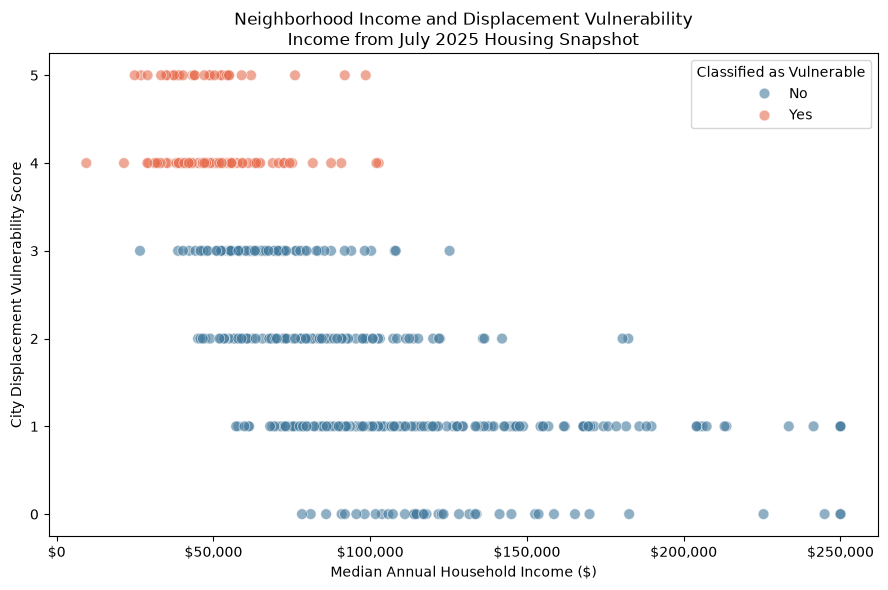
Higher City vulnerability scores appear more often among lower-income NPAs. This is descriptive rather than a synchronized test because the vulnerability layer and July 2025 income snapshot do not have a verified common observation period.
The City classification reflects some of its own inputs
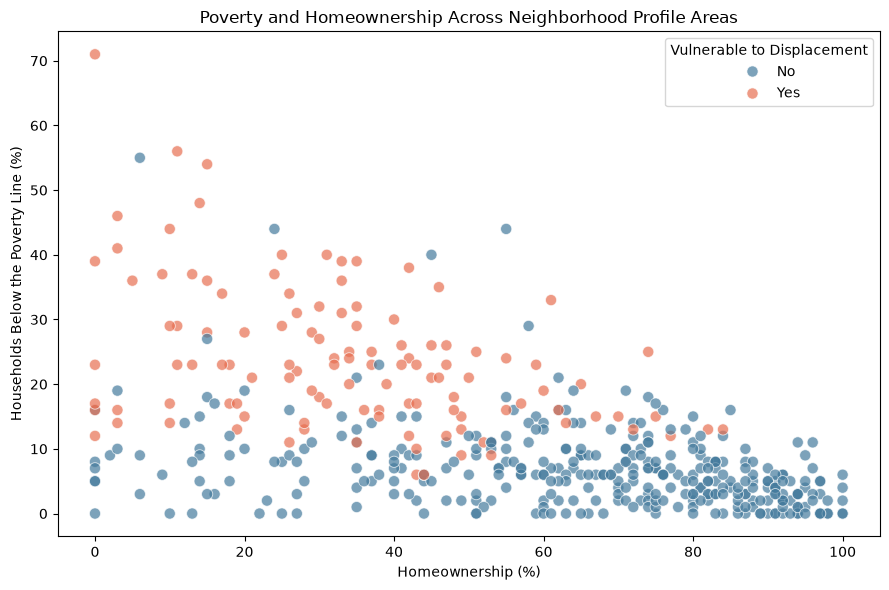
Many NPAs classified as vulnerable appear in areas with higher poverty and lower homeownership. Poverty and homeownership already contribute to the City's score, so part of this pattern follows from how the classification is built. It should not be treated as independent confirmation of displacement.
Limitations and Next Steps
The results are useful for finding patterns, but they need to be read with care.
- This study measures affordability pressure and vulnerability, not whether a household was forced to move. The original questions about confirmed gentrification and changes in affordable housing remain unanswered because the project does not include valid longitudinal measures of those outcomes.
- ACS estimates include sampling uncertainty, especially for smaller groups. The correlation comparison does not carry that uncertainty into the coefficients, and excluding nine incomplete tracts may affect how representative the final sample is.
- The measures describe different populations. Median income includes owners and renters, rent burden covers cash-rent renter households, education covers adults 25 and older, and racial composition covers the entire tract. Tract-level correlations cannot be used to make claims about individuals.
- Each tract receives equal weight, nearby housing-market conditions are not modeled, and the analysis shows association rather than cause. Race is included to examine how housing pressure is distributed, not to label residents or neighborhoods as responsible for that pressure.
- A stronger follow-up would use renter-specific income, comparable time periods with harmonized boundaries, inflation-adjusted costs, dated affordable-housing additions and losses, and direct evidence such as longitudinal household data or resident surveys.
Tools and Methods
References
References are formatted in APA style. The second column explains how each source contributed to the project.
| APA Citation | Role in the Analysis |
|---|---|
| City of Charlotte (n.d.-a). Housing Locational Tool [Data set]. ArcGIS REST Services. https://gis.charlottenc.gov/arcgis/rest/services/HNS/NPA_HLT/FeatureServer/0 | Provided July 2025 neighborhood income for a separate NPA comparison. Sales-price fields were investigated but not used for conclusions. |
| City of Charlotte (n.d.-b). Vulnerability to displacement by NPA [Data set]. ArcGIS REST Services. https://gis.charlottenc.gov/arcgis/rest/services/ODP/City_Space_ODP_Data/MapServer/1 | Provided the City vulnerability score and classification, along with poverty, homeownership, education, age, and demographic fields. |
| U.S. Census Bureau (n.d.). 2024 American Community Survey five-year detailed tables [Data set]. Census Data API. https://api.census.gov/data/2024/acs/acs5.html | Provided 2020–2024 estimates of income, rent, population, rent burden, employment, education, racial and ethnic composition, and housing tenure. |
| U.S. Census Bureau (2018). Instructions for applying statistical testing to American Community Survey data. https://www2.census.gov/programs-surveys/acs/tech_docs/statistical_testing/2018_Instructions_for_Stat_Testing_ACS.pdf | Provided the statistical guidance used to create and interpret the approximate uncertainty ranges. |